This is the second installment in Love & Company’s 2023 blog series on the health of the home resale market. Our February 7, 2023 blog set the stage for this discussion with a deep analysis of six key performance indicators, including how changing trends from recent years may impact prospects’ willingness to sell their homes and make a move to senior living. This update focuses on what has changed in the market since the early part of the year and how these emerging trends may affect the senior living field. As needed, we refer back to the original blog for full details on our ongoing analysis.
Mortgage Interest Rate Trends
In our original blog, we noted that mortgage rates declined a bit during the summer of 2022, despite rising federal funds rates, before increasing sharply by late October. Since then, rates have fluctuated but remained fairly level. After peaking at more than 7% in October, mortgage rates dropped to around 6.3% by the end of March 2023.
Have Higher Mortgage Rates Reduced Home Resale Values?
The following graph shows the monthly median home resale value for existing single-family homes from 2019 through February 2023.
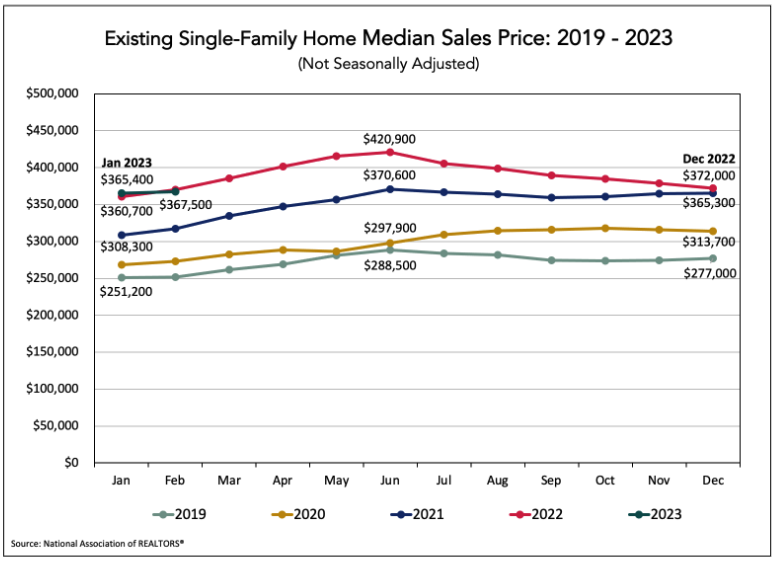
A key takeaway from the 2023 data is that year-over-year median resale values are holding steady at 2022 levels for January and February, not declining. At the same time, home values in 2023 show possible signs of returning to the typical (pre-Covid) price fluctuation pattern, with a decline from peak levels in mid-summer to a low in the December to January timeframe, before starting to increase again in early spring before peaking in mid-summer. The increase in home resale values from January to February suggests that we may be following that typical pattern. This is a trend we will follow closely as we continue into 2023.
The Pace of Sales
The chart below shows the number of existing home resales by month. The data is shown as an annualized rate of sales based on the number of sales in that month, adjusted for typical seasonality factors.
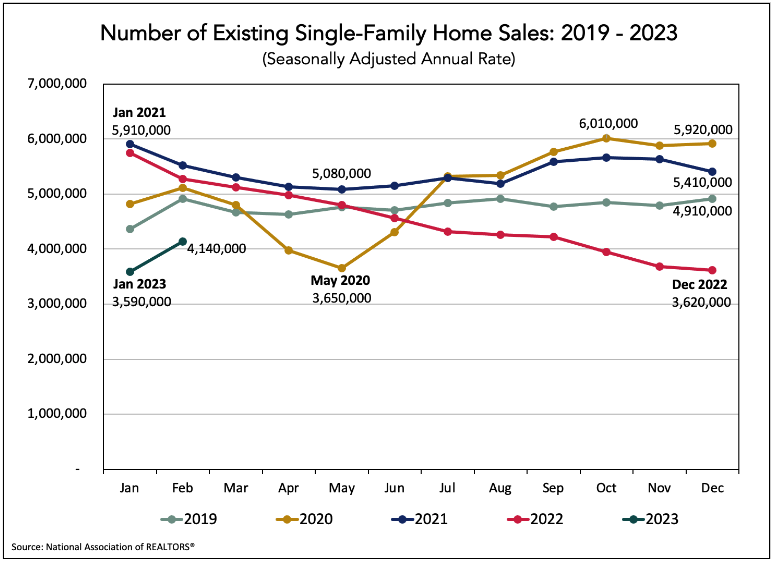
In our original blog, we noted the significant decrease in the annualized pace of sales through the end of 2022, and this trend continued through January 2023. However, in February the annualized rate of sales jumped substantially, by about 13%. This is a stronger early-year increase than we would typically see and a highly encouraging data point, as it indicates that demand is increasing, which should continue to support current home values.
Looking at pending home sales also tells a story about sales pace, as pending sales tend to lead existing-home sales by one or two months. Pending sales data and a March 2023 press release from the National Association of REALTORS® indicate that pending sales increased by about 7.5% from December to January. This is reflected in February’s strong increase in home resales. February pending home sales rose slightly (0.8%) by comparison, signaling that existing home sales may continue to rise, albeit modestly, over the next month or two.
Regional differences in sales pace are also emerging, which are corroborated by pending sales. The northeast saw the greatest monthly increase (6.5%) in pending sales from January to February, while the west decreased by 2.4%, signaling diverging trends on either side of the country. The Midwest and South each saw modest increases under 1%.
Supply and Demand, and Their Impact on Pricing
The following graph shows the supply of existing single-family homes for sale (shown as the number of months it would take to sell all the available homes at the current sales pace) for the five-year period from 2019 through 2023.
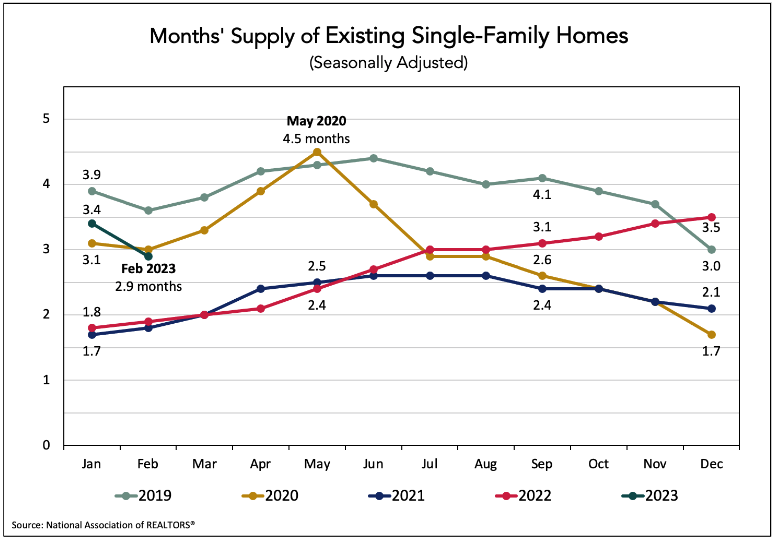
Steadily rising supply trends from 2022 have begun to go back down in 2023. The higher number of sales in February decreased the supply to only 2.9 months in February. This is another good sign from a home value perspective. A decrease in months’ supply means demand is still stronger than supply, which should support steady or possibly increasing price levels. If demand continues to increase, even slightly, as suggested by February pending sales, it could lead to further drops in the monthly supply, which puts upward pressure on prices. Even with current mortgage rates (which, as noted in the original blog, are higher than the previous few years but lower than long-term trends), should supply continue trending downward, approaching the low levels of 2021, it could again create an environment where bidding wars over limited inventory bring about abnormal increases in sales price.
The Relationship Between Mortgage Rates and the Pace of Home Resales
The following graph shows how the number of existing home resales (gold shading) has changed relative to average monthly mortgage rates (blue) and the federal funds rate (red) from 2021 through 2023.
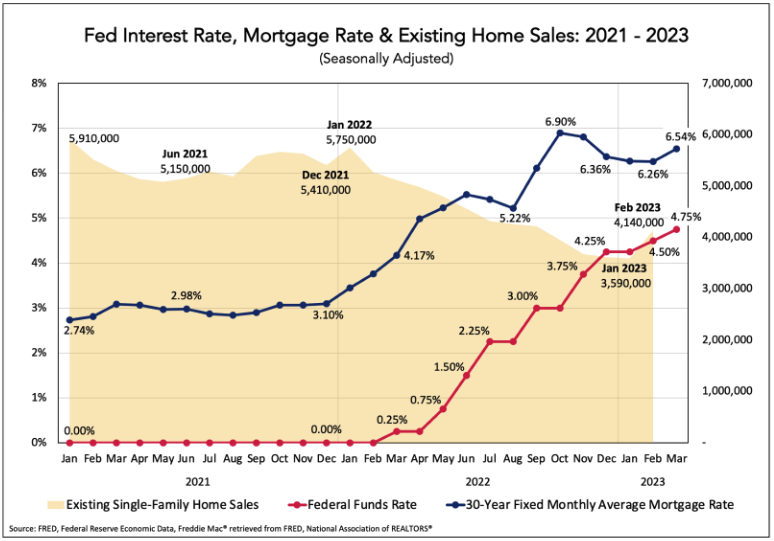
This shows a fairly direct relationship, marked by an inverse correlation between sales volume and interest rates, i.e., when rates go up, the volume of sales goes down. However, this pattern reversed in February of 2023. Despite continued increases in the fed funds rate, home resales volume increased significantly. Should sales continue to grow amid rising rates, home prices (and sales) could eventually soften as some buyers pull back from the market, fearing the increased cost of borrowing at higher interest rates.
We will continue to monitor these relationships closely and provide updates on what these changing trends could mean for prospective sellers—particularly senior living prospects who are looking to sell their home before moving to a community.
What Does It All Mean?
What we’ve seen in the early 2023 data are mainly positive indicators for those looking to “trade” their home equity to cover entrance fees at a community. To summarize, this includes:
- Falling mortgage rates at the start of 2023 preceded early sales gains, and mortgage rates are holding fairly steady, on average, in the new year.
- Home values are maintaining 2022 levels, despite significant year-over-year increases in mortgage rates.
- Decreasing supply and growing demand should support steady or rising sales prices.
So, where will the market actually move? As we move further into 2023, Love & Company will continue to track these trends and report our findings to the field. We invite you to continue to follow us during this journey.