By Rob Love, President/CEO, and Lauren Houlik, Director of Market Intelligence
The health of the home resale market is, of course, essential to the health of independent living census at Life Plan Communities. Prospects are comfortable with the idea of “trading” their home equity to pay the entrance fee for our communities, but when they become concerned about their ability to sell their home, their fear of making a move increases. So, in light of the significant increases in mortgage interest rates we experienced in 2022, should our prospects be concerned about selling their homes? And should we be concerned about the impact the home resale market may have on our 2023 sales?
While no one has a perfectly clear crystal ball on the future of home sales (alas, not even us!), we can learn a lot by closely evaluating market trends, then considering the implications of those trends on our field. As we move into 2023, Love & Company will be keeping a close eye on those trends, and we will update the field regularly on what we are seeing. This is the first of a series of blogs we plan to publish over the course of the year, so stay tuned for more, probably every two to three months depending on how fast and how much the market evolves.

Learn More Insights on How to Increase Revenues and Control Costs in 2023
View our webinar, “Overcoming Inflationary Pressures: Strategies to Increase Revenue and Control Costs in 2023,” to hear additional insights from Sara Montalto, Love & Company’s SVP of Strategic Services, Rob Love, Love & Company’s President/CEO, and Rob Clark, Managing Director of OnePoint Partners, as they explore several opportunities to positively impact margins in 2023.
Highlights
If you’d rather get straight to the bottom line (albeit without the background context) and not look at all the graphs, here are the key takeaways from our analysis.
- The recent increases in mortgage rates have slowed demand considerably, but the relationship between supply and demand is still favorable to the seller.
- The relative strength of the supply/demand relationship has enabled home resale values to stay at a somewhat high level despite the increased mortgage rates.
- What the rise in mortgage interest rates has affected the most is the pace of existing home sales, which dropped substantially in the second half of 2022.
- Mortgage rates are subject to variations in the economy just as much as they are to changes in the federal funds rate, so some market analysts are looking at the potential of a softening economy as an indicator that mortgage rates could drop in 2023, despite continuing increases in the federal funds rate.
Mortgage Interest Rate Trends
We’ll start by taking a look at mortgage interest rates over the past several years. The chart below shows the average mortgage interest rate for a 30-year, fixed interest loan for 2018 through 2022.
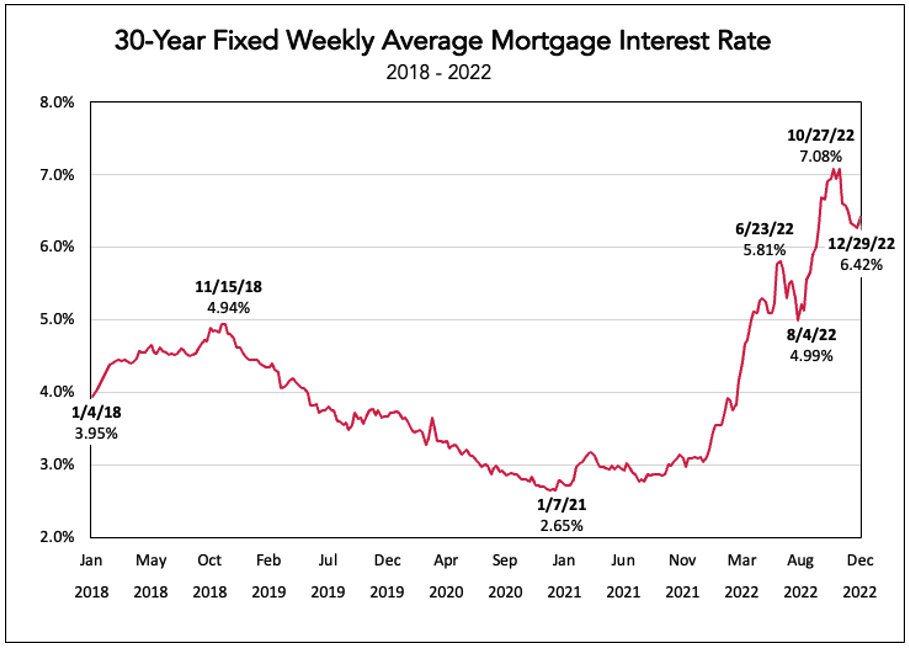
- Throughout 2018, mortgage interest rates hovered between 4% and 5% before beginning a long and steady decline, hitting their low at less than 3% in early 2021. Rates then held fairly steady around 3% through 2021 until 2022’s dramatic increase.
- An interesting observation is that, although federal funds interest rates rose steadily throughout 2022, mortgage rates dropped by about 0.8% from late June through early August. Then, after increasing by more than 2% by late October, they dropped again by about 0.7% by the end of December.
- The lesson learned is that mortgage rate changes do not directly parallel federal interest rate changes. In fact, in 2021 and 2022, the spread between the average mortgage rate and the federal funds rate ranged from only 1.86% to as much as 4.48%.
- As several market analysts have noted, mortgage rates can be affected by the overall economy just as much as by underlying interest rates.
Next let’s look at mortgage rates over a longer period of time. The following chart shows average mortgage rates over the past 50 years.
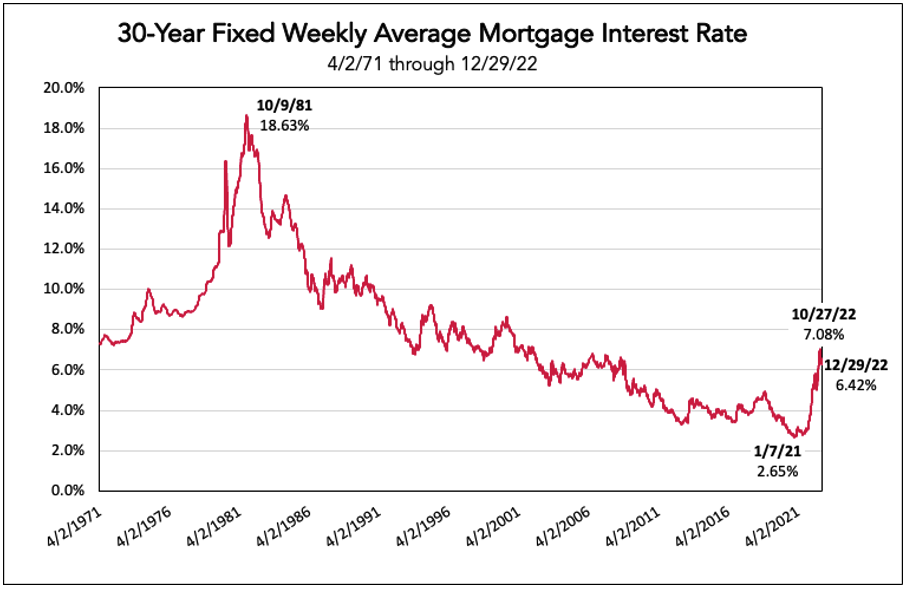
- While interest rates clearly have increased substantially in 2022, the current rates (6.42% at the end of December) are not only in line with longer term trends, but even a little on the low side. Even during the housing market “bubble” in the mid 2000s, rates hovered mostly between 6% and 7%. Prior to that, rates for the previous 30 years had been higher than where rates are today.
- What does this tell us? The current rates, though higher than the past few years, should not put a significant long-term damper on the home resale market.
Have Higher Mortgage Rates Reduced Home Resale Values?
The following graph shows the monthly median home resale value for existing single-family homes from 2018 through 2022.
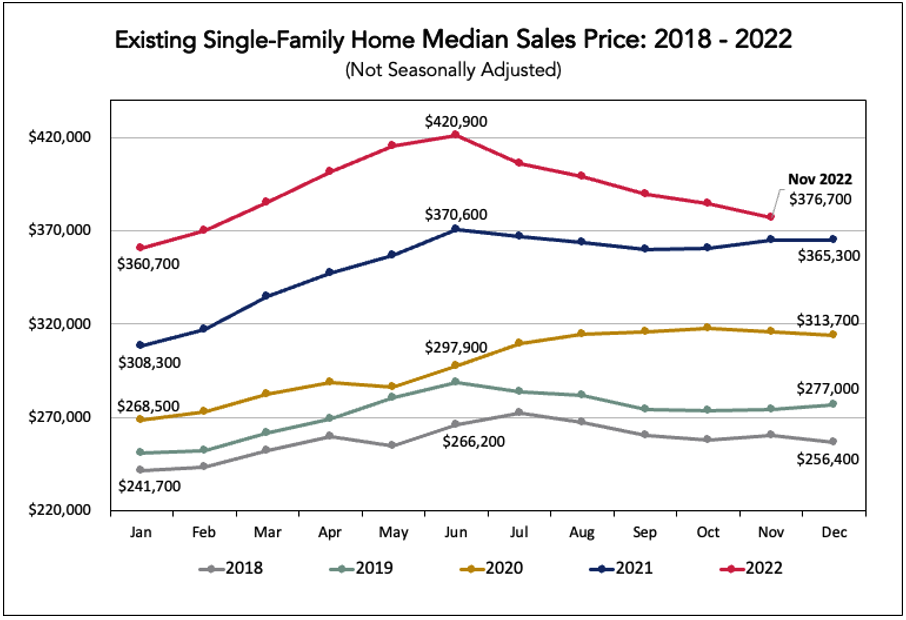
This chart is easier to follow than some later ones you’ll see, as the lines get higher for each successive year.
- What you see in 2018 and 2019 (the gray and green lines, respectively) represent what are typically “normal” years in terms of price fluctuations. Home resale values start the year low before peaking in the summer months when demand is highest, then steadily decline through the end of the year and into the beginning of the next year before repeating the cycle.
- 2020, however, brought a dramatic change to that traditional cycle. After a brief dip in May caused by the start of the pandemic, home resale values increased and stayed up through the rest of the year.
- Then, in early 2021, home values started increasing dramatically, with a year-over-year increase of an unheard-of rate of about 25% in June of 2021. From that point through the end of the year, prices held steady instead of dropping.
- As in 2021, 2022 started with another strong increase in resale values, once again peaking in the middle of the year, as is typical. Then, in the second half of the year, resale values started dropping.
- Though it is normal for resale values to decline in the second half of the year, you can see that the 2022 decline was a little greater than the more typical declines of 2018 and 2019. But it was not far out of line from what may have been expected in pre-pandemic years.
So did prices start to fall simply because of the interest rate increase? Is the end-of-year decline simply a reversion to pre-pandemic annual fluctuations? Or is some other factor in play? While the answer is likely a combination of “all of the above,” what will be most important is to continue to monitor resale values for the next several months. If we follow a typical fluctuation cycle, resale values should continue to decline in December, January and February, then should start increasing again from March through mid-summer.
The Pace of Sales
Another important barometer of the home sale market is the pace of sales. The chart below shows the number of existing home resales by month. The data is shown as an annualized rate of sales based on the number of sales in that month adjusted for typical seasonality factors.
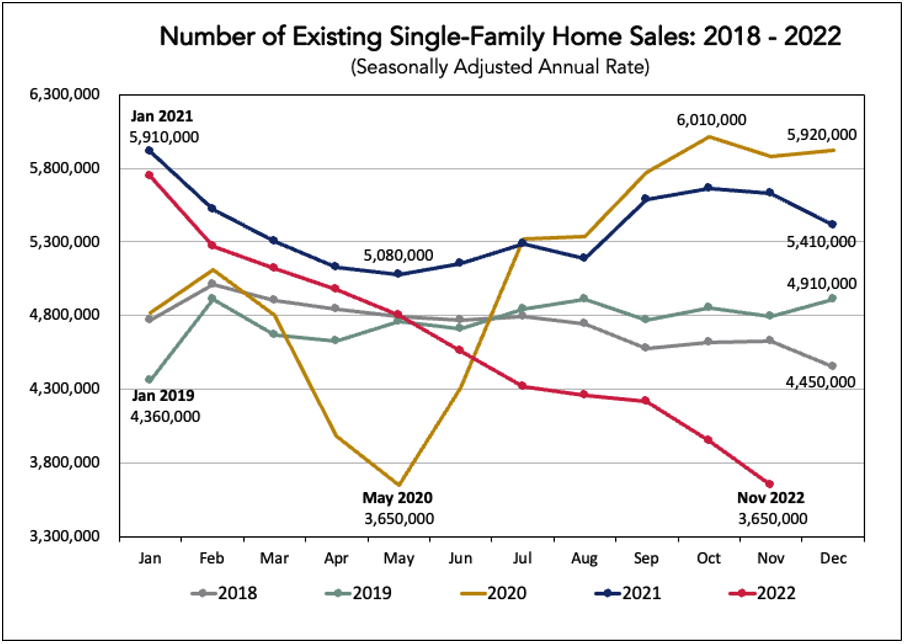
- The annual pace of sales in 2018 (gray line) and 2019 (green line) were fairly steady through most of both years, running from around 4.6 million to 4.9 million homes.
- The pace of sales dropped off sharply in the second quarter of 2020 (gold line) due to the overall shutdown of businesses during the early stages of the pandemic.
- Then, starting in July of 2020, the pace of sales exploded, running almost 20% higher than in earlier years.
- A higher pace of sales continued throughout 2021 (blue line) before the sales pace began slowing steadily at the beginning of 2022 (red line).
- By November of 2022, the annualized pace of sales had fallen off dramatically, almost 25% lower than the pre-pandemic levels of 2018 and 2019.
Supply and Demand, and Their Impact on Pricing
A basic principle of economics 101 courses is the relationship between supply, demand and price. If supply is high relative to demand, then prices tend to fall. But if demand is high relative to supply, then prices will increase. This latter scenario is what drove the dramatic increase in pricing we saw from mid-2020 through mid-2022.
The following graph shows the supply of existing single-family homes for sale (shown as the number of months it would take to sell all of the available homes at the current sales pace) for the five-year period from 2018 through 2022.

- The gray and green lines near the top show the months’ supply for 2018 and 2019, respectively. Through most of these two years, the available supply of homes would have taken between 3.7 and 4.4 months to sell.
- Then, with the dramatic increase in the volume of sales from mid-2020 (the gold line) through the end of 2021 (the blue line), the higher demand and faster sales pace of homes pushed the months’ supply down, reaching a low of 1.7 in December of 2020 and January of 2021. With high demand and low supply (at least relative to the demand; we’ll see in the next graph that the number of sales rose dramatically), home resale values were pushed higher and higher.
- As the market cooled off in 2022 (the red line)—and yes, as mortgage rates increased—the pace of sales slowed (as shown in the previous graph), and the months’ supply slowly increased.
- By November of 2022, the supply had risen to 3.5 months. However, this supply rate is still lower than what the market experienced for almost all of 2018 and 2019.
- What does this mean? In an August 18 Bankrate article by Jeff Ostrowski, “The real estate rule of thumb says that a balanced market—one that favors neither buyers nor sellers—is characterized by five to six months of supply.” That means that, relative to historic trends, the balance of supply and demand makes it still a sellers’ market, which is why home resale values have not dropped as much as one might think given the dramatic increase in mortgage rates.
The Relationship Between Mortgage Rates and Home Resale Values
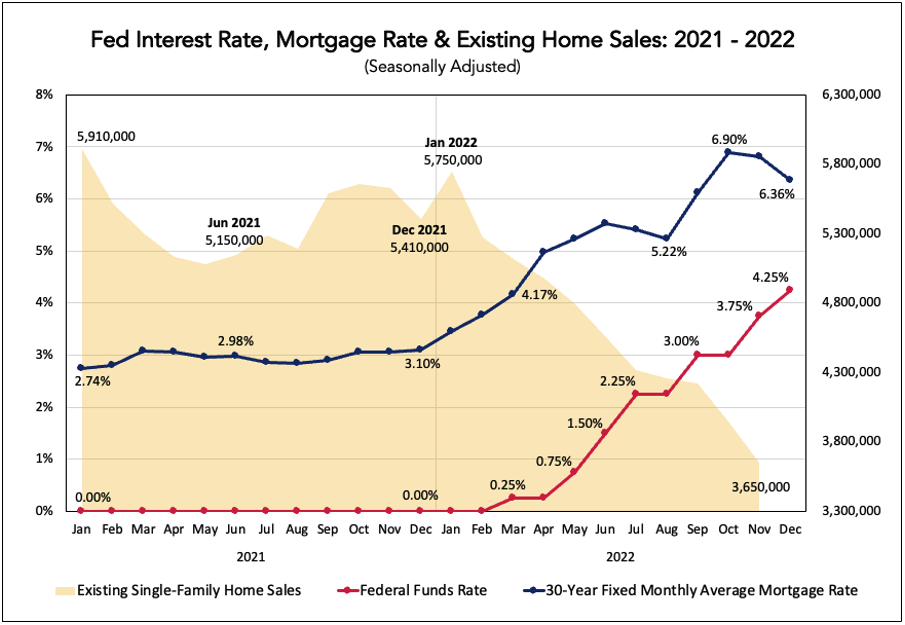
Just how much of an impact are the increases in mortgage rates having on home resale values? The following graph shows how the home resale values (gold shading) have changed relative to mortgage rates (blue) and the federal funds rate (red) in 2021 and 2022.

This chart tells some interesting stories.
- Mortgage rates started increasing in December of 2021, whereas the federal funds rate did not start increasing until March of 2022.
- Mortgage rates dropped from June to August of 2022, a period in which the federal funds rate increased by 0.75%.
- Home resale values steadily increased over the first half of 2022 (as they typically do in most years), despite mortgage rates increasing by nearly 2.5% during that same period.
- Home resale values began dropping in later summer of 2022, despite mortgage interest rates falling during this time period.
The bottom line? Although mortgage rate changes do have an impact on home resale values, rates alone do not appear to be the primary driver of resale value changes. Home resale values can clearly increase even when interest rates are increasing.
The Relationship Between Mortgage Rates and the Pace of Home Resales
If mortgage rate increases don’t directly affect home resale values (at least not substantially), what do they affect? The answer is the pace of sales, i.e., the demand side of the market. The following graph shows how the number of existing home resales (gold shading) has changed relative to mortgage rates (blue) and the federal funds rate (red) in 2021 and 2022.
- This graph shows a far more direct relationship between mortgage interest rate changes and the pace of home resales than we saw with rates’ impact on resale values.
- When mortgage rates started increasing early in 2022, the pace of sales started dropping and continued to drop throughout the year as rates continued to rise.
So, not surprisingly, mortgage rate increases have a significant impact on the demand side of the equation: the number of home sales drops, and the number of months’ supply increases, as we saw in an earlier graph.
What Does It All Mean?
As always, it’s easier to look backwards to explain why we are where we are than it is to look forward and project what may happen in the coming year. So first, let’s summarize the key things we’ve seen in the data so far, and some of the questions these findings raise.
- The dramatic increase in the value of home sales was driven more by a sharp increase in demand coupled with limited supply—the ultimate sellers’ market—than it was just by low interest rates.
- The recent increases in mortgage rates have slowed demand considerably, but the relationship between supply and demand is still (relatively speaking, over a longer period of time) favorable to the seller, as the months’ supply of homes has not yet returned to pre-pandemic levels (though it could soon).
- The relative strength of the supply/demand relationship has enabled home resale values to stay at a somewhat high level. Though resale values dropped through the second half of 2022, that drop was not anywhere near as precipitous as the drop in the pace of sales. In fact, through November, existing home resale values were still higher than they were a year earlier, despite the substantial increases in mortgage rates.
This leads to some important questions for 2023:
- Will mortgage rates continue to fall, start rising again or stay steady?
- Will demand for homes begin increasing from the low levels at the end of 2022?
- How will these factors affect our prospects’ ability to sell their homes?
Even though the changes the Federal Reserve makes to its federal funds rate do impact mortgage rates, and even though the Fed is expected to continue to raise rates in 2023, the Fed’s increases are expected to get smaller as inflation eases and the economy softens. Mortgage rates are subject to variations in the economy just as much as they are to changes in the federal funds rate, so some market analysts are looking at the potential of a softening economy as an indicator that mortgage rates could drop in 2023, despite continuing increases in the federal funds rate.
In fact, analysts saw signs of that in December. Market observers saw December’s drop in mortgage rates as a potentially encouraging sign, but with a fair degree of uncertainty as to whether this will continue. Similarly, mortgage applications picked up at the end of the year (not surprising given the decrease in rates), which could also be a good sign. But these are both very short-term trends right now.
Where will the market actually move? As we move further into 2023, Love & Company will continue to track these trends and report our findings to the field. We invite you to continue to follow us during this journey.