This is the fourth installment in Love & Company’s 2023 blog series on the health of the home resale market. Our February 7, 2023 blog set the stage for this discussion with a deep analysis of six key performance indicators, including how changing trends from recent years may impact prospects’ willingness to sell their homes and make a move to senior living. This update focuses on what has changed in the market since our April and June updates, and how these continuing evolutions may affect the senior living field. As needed, we refer back to the original blog or the June update for full details on our ongoing analysis.
Mortgage Interest Rate Trends
In our original blog, we noted that mortgage rates declined a bit during the summer of 2022, despite rising federal funds rates, before increasing sharply by late October. Since then, mortgage rates have fluctuated but remained fairly level for many months. However, since our last update, mortgage rates have increased by about 1/3 of 1%, going just over 7% (7.05%) in late August. This was likely fueled by the Fed’s July increase of the federal funds rate by another 0.25%, and is the highest average mortgage rate since November 10, 2022 (7.08%).
Have Higher Mortgage Rates Reduced Home Resale Values?
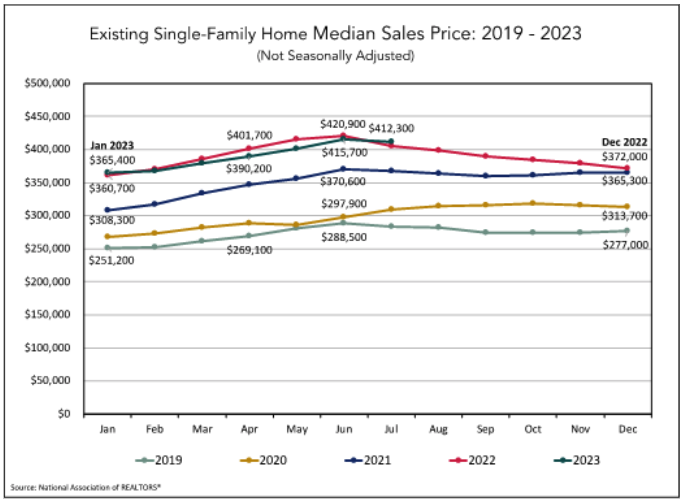
The following graph shows the monthly median home resale value for existing single-family homes from 2019 through July 2023.

The 2023 data continue to show year-over-year median resale values that are holding steady near 2022 levels, with July data actually showing a year-over-year increase of $6,500, or about 1.6%. So while the increases in mortgage interest rates are keeping sales prices from the types of increases we’ve seen the past several years, there also has not yet been any meaningful decrease.
Note: You may notice that July’s median resale value declined slightly from June, but that’s part of a normal annual fluctuation where home values typically peak in the middle of the year, then fall slightly through the fall and winter.
We will continue to follow resale value trends closely throughout the rest of 2023.
The Pace of Sales
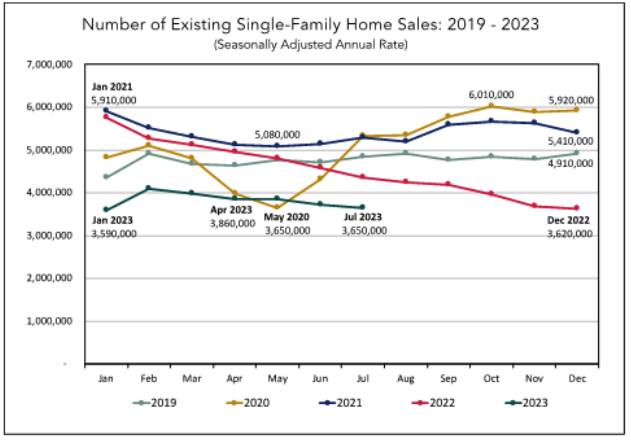
The graph below shows the number of existing home resales by month. The data are shown as an annualized rate of sales based on the number of sales in that month, adjusted for typical seasonality factors.

In our original blog, we noted the significant decrease in the annualized pace of sales through the end of 2022, and this trend continued through January 2023. Since a small uptick in February, however, the annualized rate of sales has slowly trended downward through July. The year-over-year current sales pace is about 16% below 2022 levels.
Are Regional Markets Performing Differently than the Nation?
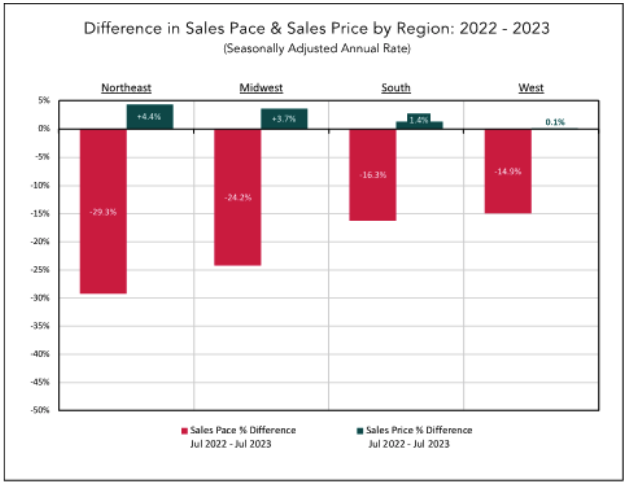
Year-over-year changes in sales price and pace show diverging trends across regions. While some markets experienced a greater decline, others have shown a stronger ability to maintain or even increase home values.
Our June update reported that all regions were experiencing substantial declines in the number of sales from 2022 levels, led by the West region with 2023 volumes more than 45% below 2022 levels. And while the volume of sales continues to be lower this year in all four regions, the gap is not as large as it was earlier in the year.
On a more positive note, in July year-over-year home resale values increased in all four regions, with the Northeast up 4.4%, the Midwest up 3.7%, the South up 1.4% and the West ticking up just slightly at 0.1%.

Supply and Demand and Their Impact on Pricing
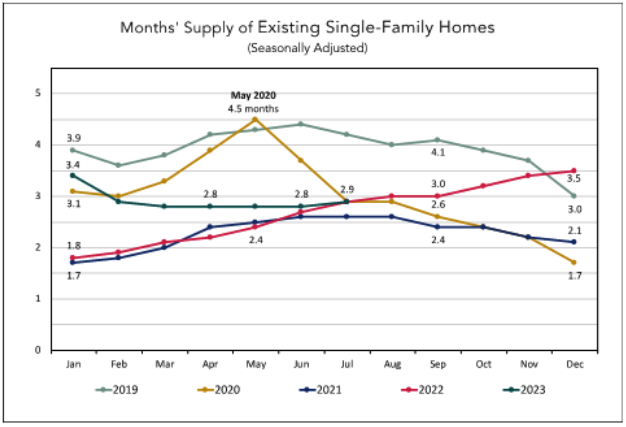
The following graph shows the supply of existing single-family homes for sale (shown as the number of months it would take to sell all the available homes at the current sales pace) for the five-year period from 2019 through 2023.

In 2023, the number of months of inventory supply declined from January to March, then stayed fairly steady since then, ending July at 2.9 months, the same level as February. While the months’ supply of inventory continues to be higher than 2021 and the first half of 2022, it still is at a relatively low level from an historical perspective. This low level of supply is the main factor that continues to keep home values from decreasing, as it is keeping us in a seller’s market.
What Does It All Mean?
So far in 2023, home resale values have remained at historic high levels despite continuing increases in interest rates. This is good news for seniors that are considering a move to a retirement community, as in most markets they are still able to sell their homes for high values.
Key takeaways from this update are:
- We have seen a fairly typical year in terms of home resale values steadily rising through the spring and early summer, before starting to edge back downward in July. It is reasonable to expect them to follow that normal pattern, continuing to decline modestly through the end of the year.
- While mortgage rates continued to rise through July, median home resale values still increased modestly over 2022 levels.
- The strength in home values continues to be sustained by relatively low inventory levels of homes for sale, keeping us in a seller’s market.
As we move toward the end of 2023, Love & Company will continue to track these trends and report our findings to the field. We invite you to continue to follow us during this journey.


