This is the third installment in Love & Company’s 2023 blog series on the health of the home resale market. Our February 7, 2023 article set the stage for this discussion with a deep analysis of six key performance indicators, including how changing trends from recent years may impact prospects’ willingness to sell their homes and make a move to senior living. This update focuses on what has changed in the market since our April 27, 2023 update and how these emerging trends may affect the senior living field. As needed, we refer back to the original article or the April update for full details on our ongoing analysis.
Mortgage Interest Rate Trends
In our original article, we noted that mortgage rates declined a bit during the summer of 2022, despite rising federal funds rates, before increasing sharply by late October. Since then, mortgage rates have fluctuated but remained fairly level, despite the federal funds rate increasing five times, from 3% in October to 5% by May 2023. Interest rates are now showing signs of increasing again, in the wake of the latest (May 4th) federal funds rate hike.
After peaking at more than 7% in October 2022, mortgage rates dropped to around 6.3% by the end of March 2023 and hovered there throughout April, before rising in May. Rates have been increasing weekly since May 11th, growing from 6.35% to 6.79% by June 1st. This is the highest interest rate in 2023 so far, and the highest since November 10, 2022 (7.08%).
The Federal Reserve will announce its next rate decision on June 14th, with many economists predicting no increase to the federal funds rate in June (perhaps in July). Depending on the Fed’s decision, we may see the beginning of a mortgage rate correction or continued increases, approaching peak levels from last October.
Have Higher Mortgage Rates Reduced Home Resale Values?
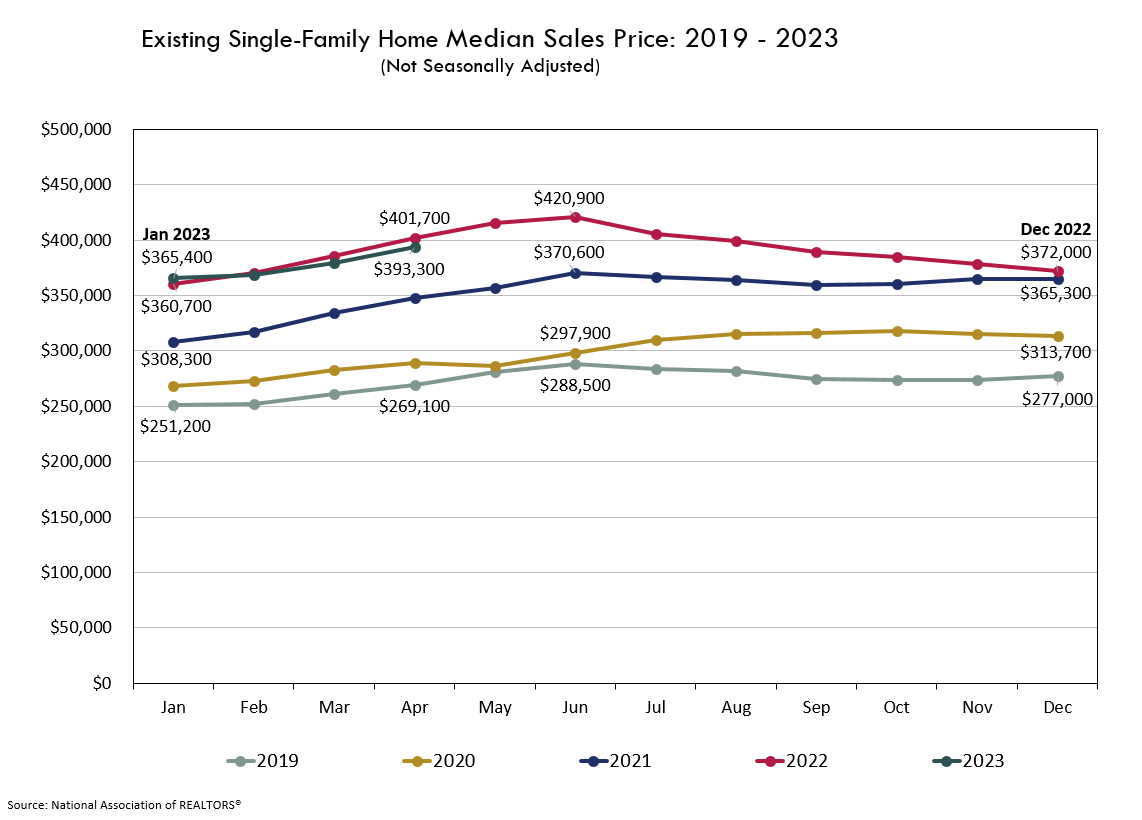
The following graph shows the monthly median home resale value for existing single-family homes from 2019 through April 2023.

The 2023 data show year-over-year median resale values that are holding steady near 2022 levels. The sales prices for March and April have fallen by about 2% compared to a year prior, due to 2023 resale values increasing at lower rates as they approach the mid-summer peak. This may indicate that home values are returning to the typical (pre-COVID) price fluctuation pattern, which would produce more modest peak levels during summer months. While current sales prices are slightly below last year’s levels, the modest deviation is not yet cause for concern. Should this trend continue, falling further behind 2022 levels, it may contribute to a more challenging senior living sales environment should prospects become less willing to sell their homes at a perceived discount from a year prior.
We will continue to follow resale value trends closely throughout the summer and the rest of 2023.
The Pace of Sales
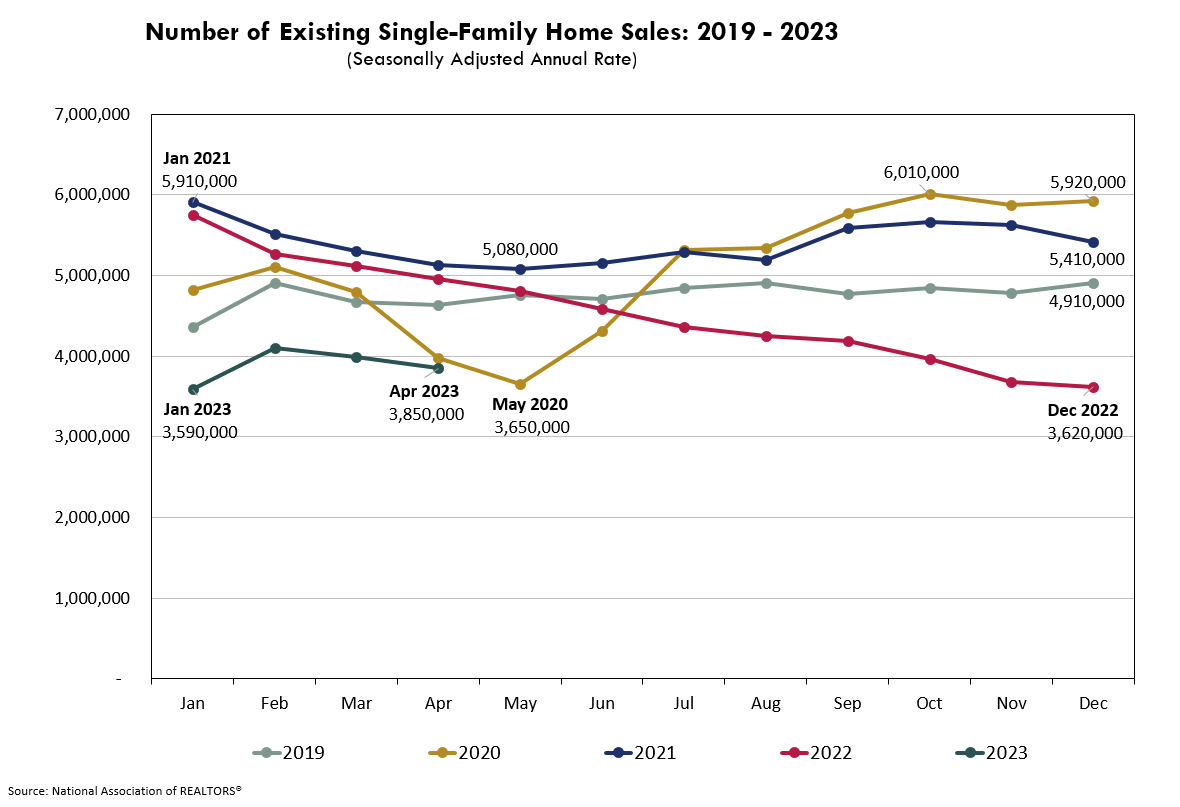
The graph below shows the number of existing home resales by month. The data is shown as an annualized rate of sales based on the number of sales in that month, adjusted for typical seasonality factors.

In our original article, we noted the significant decrease in the annualized pace of sales through the end of 2022, and this trend continued through January 2023. In our April update, we highlighted an increase in February sales, postulating an increase in demand that would support modestly rising sales. However, with dwindling inventory, the annualized rate of sales resumed its downward trajectory with small monthly decreases through April. The current sales pace is 29% below 2022 levels and slightly below 2020 levels, when much of the nation was still sheltering in place. A reversal of February’s previously encouraging data, this new trend suggests that limited inventory is stifling sales.
Looking at pending home sales also tells a story about sales pace, as pending sales tend to lead existing home sales by one or two months. Pending sales data from the National Association of REALTORS® indicate that, after increasing in January and February, pending sales decreased in March and held steady in April. The flat sales are notable, as April is usually one of the busiest months of the year. Over 20% below last year’s pace, the flat contract signings in April signal a milder spring and early summer homebuying season, marked by limited inventory and gradually increasing mortgage rates. This is reflected in the recent decreases in home resales, approaching the lowest levels in the last five years.
Are Regional Markets Performing Differently than the Nation?
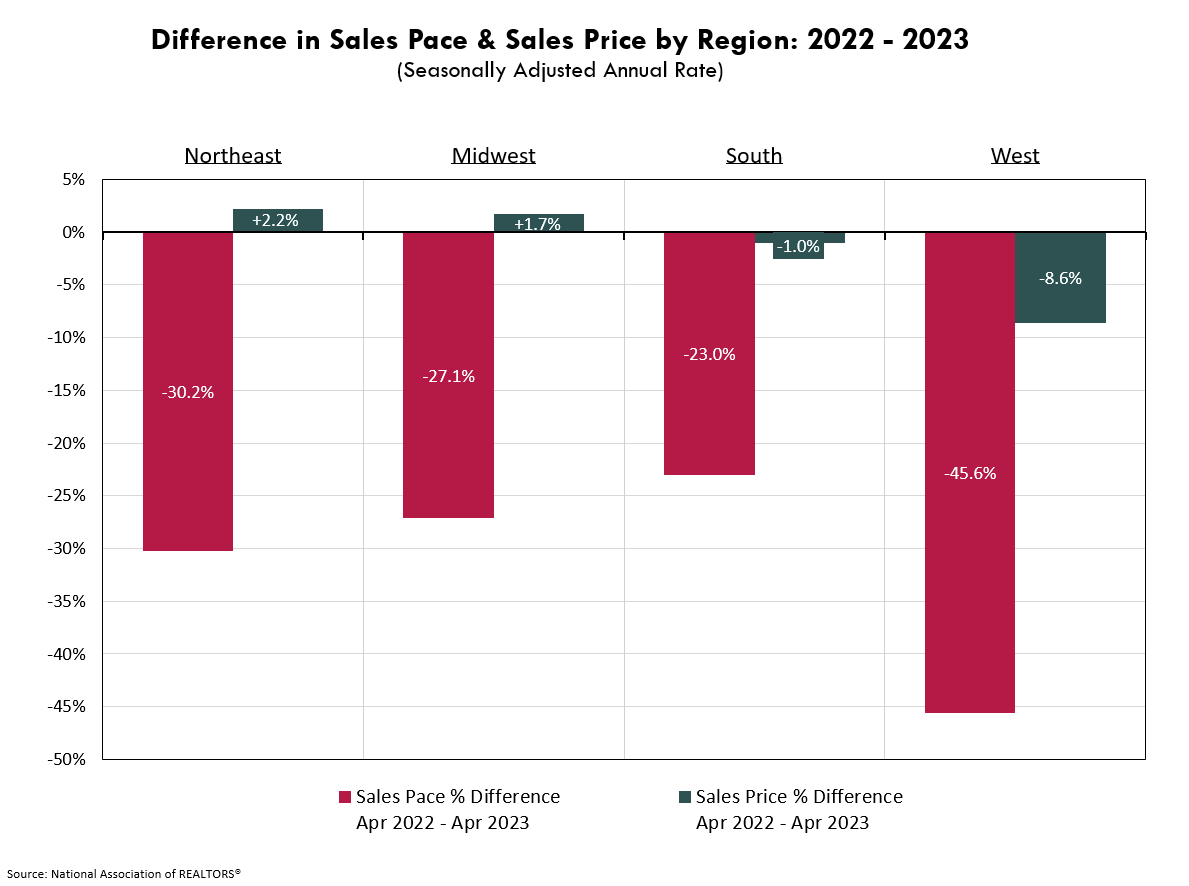
Year-over-year changes in sales price and pace show diverging trends across regions. While some markets are signaling concerning signs of a slump, others appear better positioned to capitalize on the mid-summer peak in sales.
Markets in the West show the greatest decline in both sales and price, with April 2023 volumes more than 45% below 2022 levels, and prices that are nearly 9% lower. However, these initially concerning indicators show signs of improving, as the West saw the greatest monthly increase (4.7%) in pending sales from March to April. Pending sales in the West region remain 35% below 2022 levels.
Home sales in the Northeast are down more than 30% compared to April 2022, but show a modest (2.2%) increase in sales price, which is a positive indicator moving into the busy summer months. However, pending sales in the Northeast fell by about 11% from March to April and remain nearly 28% below 2022 levels. While this could suggest a cooling market in the Northeast, given increasing prices, it is more likely symptomatic of the inventory shortage.
The Midwest and South saw more modest decreases in sales and smaller price fluctuations. March to April pending sales held steady in the South, while the Midwest saw 3.6% more contract signings in April.

Supply and Demand and Their Impact on Pricing
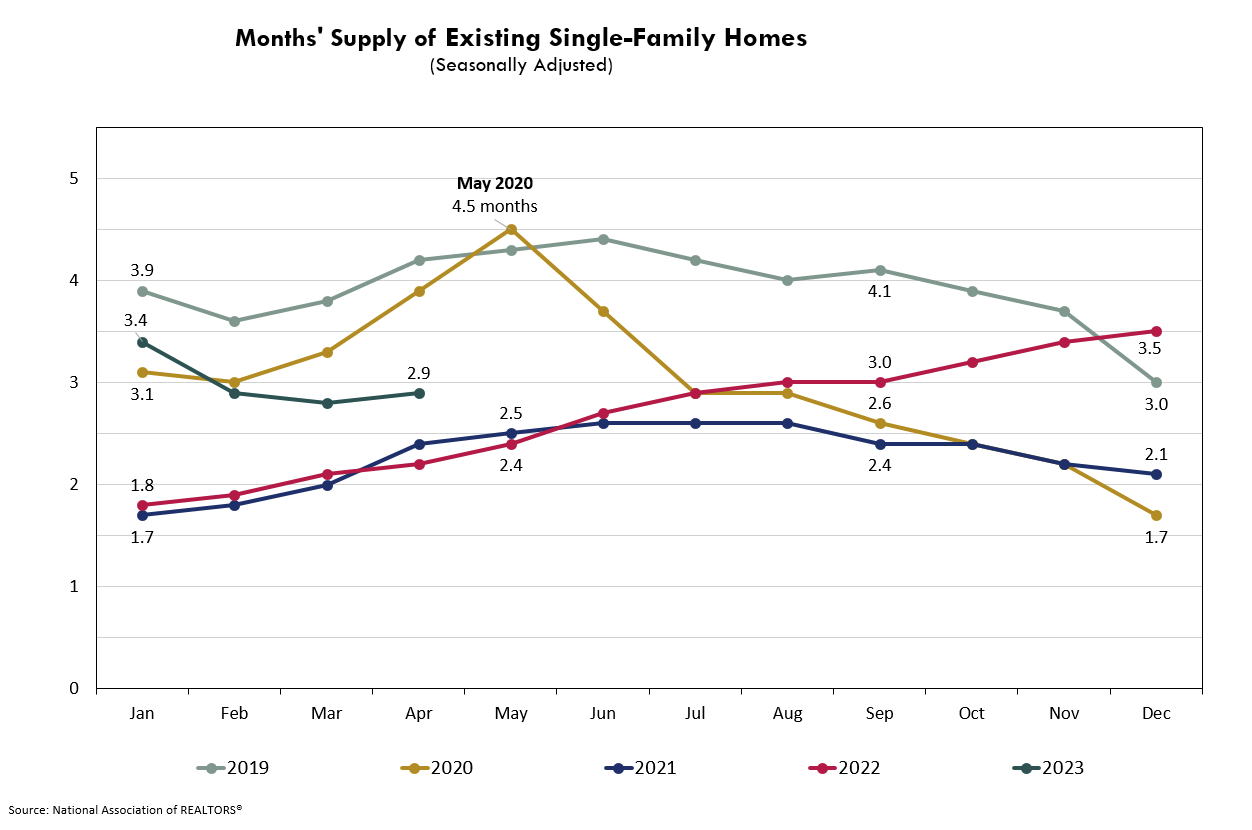
The following graph shows the supply of existing single-family homes for sale (shown as the number of months it would take to sell all the available homes at the current sales pace) for the five-year period from 2019 through 2023.

Steadily rising supply trends from 2022 are falling in 2023. The spike in February sales decreased the supply to just 2.9 months, which has held fairly steady through April. This is a mixed indicator from a home value perspective, as consistent months’ supply means demand is in line with the current inventory levels, and the current levels are well below industry norms for a balanced market. While this could support the typical summer price increases, as more buyers enter the market before the start of the school year, the limited inventory and increasing mortgage rates may keep some buyers out of the market until conditions improve. Even with current mortgage rates (which, as noted in the original article, are higher than the previous few years but lower than long-term trends), should supply continue trending downward in 2023, approaching the low levels of 2021, it could again create an environment where bidding wars over limited inventory bring about abnormal increases in sales prices.
What Does It All Mean?
What we’ve seen so far in the 2023 data are mixed indicators for those looking to “trade” their home equity to cover entrance fees at a community. To summarize, this includes:
- Falling mortgage rates at the start of 2023 preceded early sales gains, but after rates increased in March, the pace of sales softened through April. Mortgage rates have been rising weekly since May 11th, the impact of which is not yet reflected in the sales data but may result in more modest mid-summer peaks in price and volume.
- Home values remain near 2022 levels but are starting to show signs of trending slightly below peak sales prices from last year.
- Steady pending sales in April indicate a lack of inventory in the market, which could bolster demand and increase prices, or keep buyers who are unwilling to engage in bidding wars out of the market to wait for conditions to improve. This should support steady or rising sales prices.
So, where will the market actually move? As we move into the second half of 2023, Love & Company will continue to track these trends and report our findings to the field. We invite you to continue to follow us during this journey.


