Beginnings are important. In life and in project planning, they set the stage for everything that comes after. Whether for new development, an expansion or repositioning a community, project planning should always start with a detailed look at your market.
Some aspects of market analyses may appear to have become commodities: put demographics and competition in, and market potential comes out. However, an analysis is rarely that simple. Decisions regarding the study design and the data upon which analysis is based set the stage for everything that follows. It is worth taking the time to understand how your study will be constructed as you begin the process because differences do exist.
Here are just a few of the key components to consider as you prepare to undertake an evaluation of your market.
THE MARKET AREA
Every analysis is based on a geographic study or market area, which is then evaluated carefully. If the study is for an expansion, repositioning or a nearby new development, we use the community’s historic draw as one key measure to establish the study area. It is worth noting that, over the past few years, many markets appear to be dissipating geographically. That is, residents are being drawn from a more dispersed area.
Although the primary market area (or PMA) has traditionally been defined as the geography from which 60% to 70% of residents originated, we are seeing many communities now only pulling 50%, and sometimes less, from the PMA. The density of draw has been diminishing with more residents coming from more ZIP code areas, but not necessarily in heavy concentrations from any specific location, making it difficult to define many ZIPs as part of the primary market. This can result in a significantly larger market area, or an area that represents fewer residents. We start with your insights on your local market, then supplement it with our data.
THE INCLUDED DATA
When considering a study methodology, it is valuable to understand what data will be used and the sources. All data should be actionable (not just data for data’s sake), and it should allow for the best possible market segmentation.
Quantifying households that fall into pre-selected age and income groups helps determine the primary measure of the potential market area. At Love & Company, we leverage a powerful geospatial market analysis platform, custom built for the senior living field, that pairs nationwide provider information with comprehensive demographic and change-of-address data. This provides us with two key types of enhanced information: demographic and competitive.
In addition to the standard demographic estimates for the current year and a five-year projection developed by one of the nation’s most significant sources of demographic data, the integration of national change-of-address data allows us to analyze local moving patterns and compare them to the underlying market dynamics, such as qualified household density, home values and home ownership. This additional perspective affords a unique advantage when defining market areas. We use it to assess competitors’ historic resident draw patterns, identify underserved areas, delineate distinct market regions and more. The result is a more accurate segmentation of the market and less “extrapolation” or fewer assumptions. With this, we can identify optimal primary and secondary market areas, supported by local moving patterns for senior living and demographic trends.
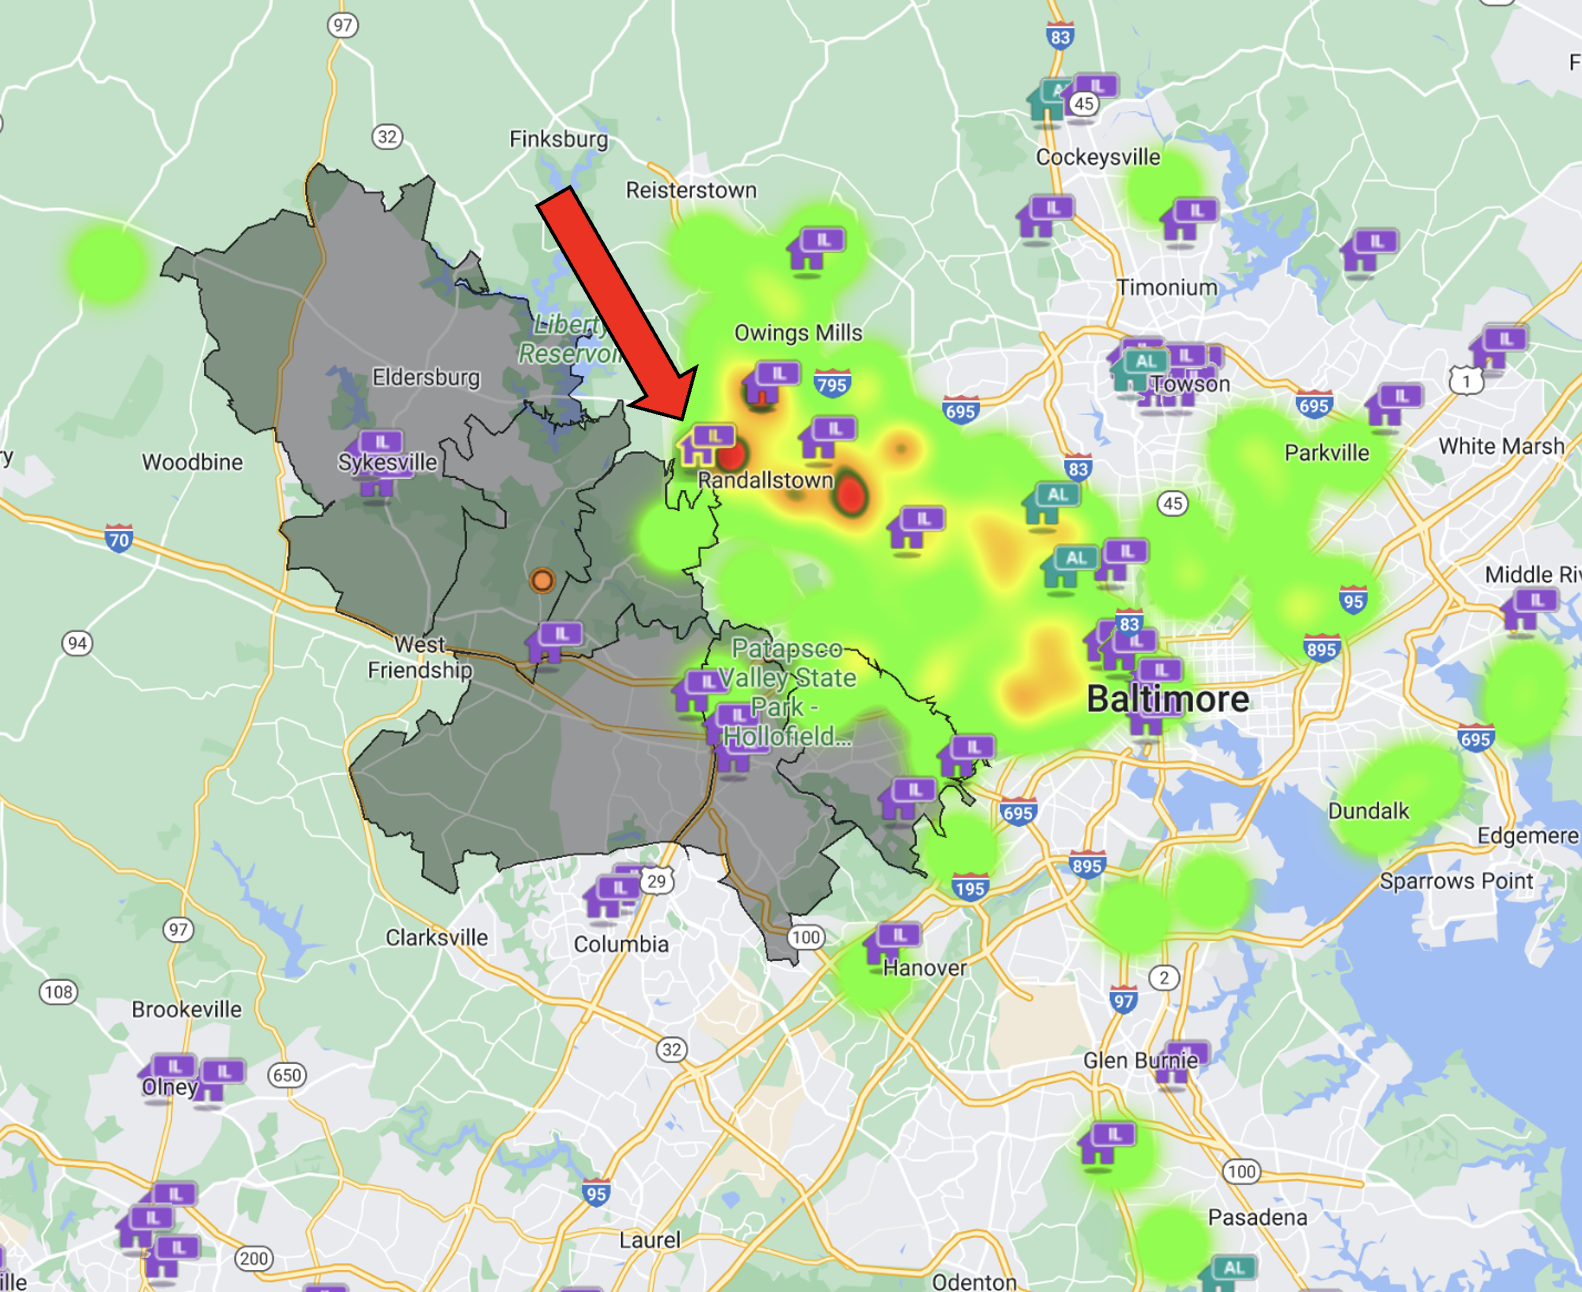
For example, the following map shows a defined PMA in grey, the locations of competitors offering independent living and the resident origins of a community just outside the PMA boundary (identified by a red arrow). Each bright green circle represents one household that has moved to the community, while yellow/orange/red areas indicate multiple residents’ former location(s). Often, communities along a PMA boundary are partially competitive, meaning they draw a limited (typically about 30%) percentage of residents from within the defined market area. However, as demonstrated by the PMA-adjacent competitor’s draw patterns below, draw from within the grey shaded area is minimal. This suggests that the PMA and the area to the immediate northeast are distinct markets, which is corroborated by similar draw patterns for other nearby competitors. The result of this exercise confirms the northern PMA boundary and its likely alignment with a psychological or geographic barrier in the market.
The change-of-address data also includes the percentage of residents by radius (those moving from within fixed radii distances of the community), so we can evaluate whether this is a market where the out-of-market draw factor should be adjusted using multiple communities’ origin data. In the past, this relied on client data alone.
We have observed that in many, if not most markets the most significant growth in households ages 75+ has been in those with incomes of $100K+, reflecting many years of a stable and growing economy since the 2008 financial crisis, coupled with the growth in investment and housing markets. However, the market has had less stability since late 2021 and should be monitored going forward.
Similarly, data on home ownership and home values are essential since the proceeds from the sale of a prospect’s home often fund entrance fees or will be spent down to subsidize senior living. Understanding not just median home values but also what percentage of homes within your target market are owned outright, without a mortgage, provides an enhanced perspective on how many households will be able to use their homes’ value to pay entrance fees or spend down in rental communities and assisted living.
The market analysis platform also integrates competitive data for existing and planned senior living communities across the country. With real-time market and pipeline insights on over 35,000 senior living properties, backed by more than 15 years of time-series market data at the metro level, we can evaluate a market’s competitive landscape quickly, compare the competitive supply for different sites/potential markets for development, gauge the impact of new construction, calculate market share and more. Combined with the underlying demographic data, this allows us to analyze real-time supply and demand metrics in the context of your local market dynamics and moving patterns to determine what opportunity exists within your PMA.
COMPETITIVE ENVIRONMENT
We have all observed that the expectations of the market are changing as new cohorts with different experiences and skills enter our markets. The availability of new types of amenities can and does affect the marketability of our communities. So, if analysts have not freshened their lists of services and amenities that they are documenting, you may miss important information about your marketplace.
Some of the newer market analysis elements to explore include:
-
TECHNOLOGY
Many technologies are being introduced to retirement living communities today, but two seem to rise to the top for consumers: (1) telehealth and (2) resident portals for information, service management and communication. Are prospects seeing these technologies in your competitor communities? If so, they are also likely to expect them from you.
Another area of technology that is gaining traction (although we’ve all thought about it for a long time) is robotics. With today’s staffing shortages, communities are beginning to explore resources in this area, particularly in dining and housekeeping roles. Early adopters that already use robots are reporting that not only do residents not mind them, but also they actually enjoy these new means of staff support. If your competitors employ robotics, they may well be creating an enriching experience for residents while addressing staffing and operational issues that will, in the not-too-distant future, help to control costs.
-
AMENITIES
We’ve experienced a wide array of new amenities in our site visits. The most common we have seen include gaming technology (like golf) and other sports simulators, pickleball and increasingly sophisticated outdoor dining.
Market studies and their design process should never remain static and require regular updates. Senior living is continually evolving, requiring an evolving approach to conducting a transparent and comprehensive market analysis.
RESOURCES
Many emerging amenities are identified in the updated Senior Housing Trends: 2021-2022 in the Next Generation Amenities section by Michael Martin of RLPS.