By Karen Adams, VP of Market Intelligence
Home ownership and home values are key indicators of a market’s ability to afford retirement living communities, especially for those structured around entrance fees. As a result, the past 18 months have been viewed as a particularly important period of opportunity for older-adult households who want to relocate and for providers of senior housing. Given the turmoil in the housing market over the past two years and the importance of home ownership and home values in assessing markets, we wanted to look at some broad trends and perhaps start a dialogue within the field about how shifts in home ownership and pricing may affect us now and in the future.
Housing markets, home values and home ownership are complex topics that are influenced by an array of factors. A literature search turned up several new or atypical elements in the current environment, some of which are expected to be permanent:
- The pandemic’s influence on the pursuit of larger homes that support working from home and more family time is changing the types of housing that are in greatest demand
- An employment environment in which there are increased opportunities to work from anywhere
- Employees’ willingness to leave positions in pursuit of remote working opportunities
- Innovations that accelerate the home sales process, which is changing the traditional balance ratio between supply and demand [1]
- A final topic of speculation is that seniors are staying in their homes longer, opting to renovate to support aging in place. [2] Whether this is due to an increasing percentage of households choosing to face aging issues in an owned home with new technology and on-demand services, or the fact that people are staying healthier longer and therefore making the choice of supportive living environments later is yet unknown. However, rates of home ownership among older households are, indeed, high for those age 65+ until they reach age 85+, ranging from 65 percent for those younger than age 65, 78 percent to 85 percent for those between 65 and 84, and 69 percent for those aged 85+.
- The drive for more space/larger homes may be affecting some markets more than others, with Idaho, Texas and Florida noted by one source as places where “just shy of half of the buyers in these markets were coming from out of state” in recent years. Hence, migration is another element to consider.
Weighted-average entrance fees are often measured against average or median home values, but this has the drawback that households that move to Life Plan Communities are usually represented by higher income/net worth individuals, and therefore are likely to be in homes that are higher than the median. Furthermore, it has long been recognized that home values decrease as age increases, making the application of a median for all households less reliable.
Fortunately, we now have data on home values by age groups, which provides us with estimated counts of the number of households within home value ranges. A look at national data shows that:
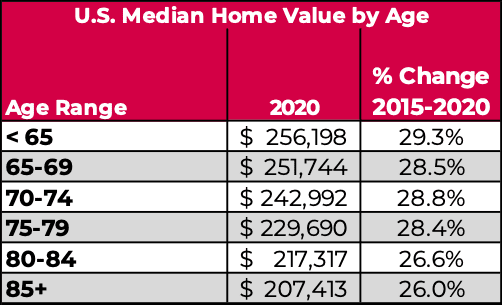
- Home values are lower among older adult households and decline with age
- Data also show the escalation of home values during the recent pandemic and some surprising trends among older adult households
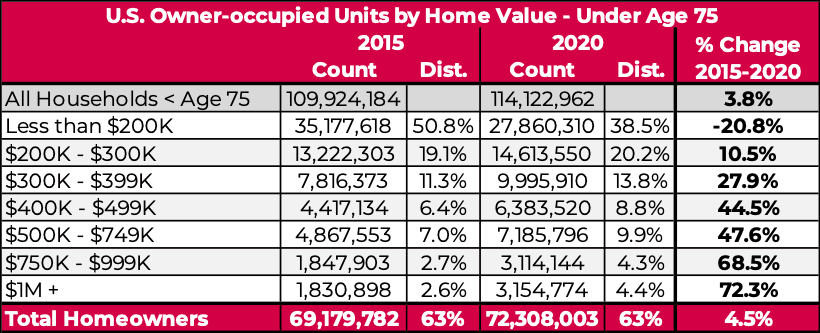
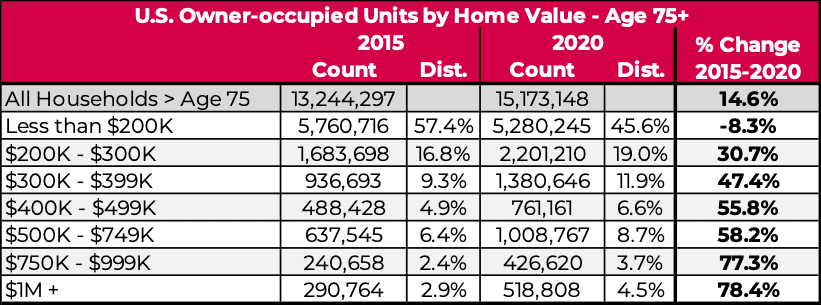
- Data on the distribution of home values within age groups show that both those younger than and older than the age of 75 experienced a decline in the percentage of whose homes are valued less than $200,000, but the decline was greater for the younger group. Less than half of those age 75+ were in this category in 2020 down from 58 percent in 2015.
- Of note is the fact that households age 75+ show higher rates of increase in homes valued at $300K or more.
- Both age groups show a significant change in the percentage of homes valued at $750K or more, with stronger growth among the older group. Eight percent of households age 75+ were in this category in 2020, compared to five percent in 2015.
- Households older than the age of 75 with homes valued at $1M or more numbered more than a half million in 2020, up 78 percent from 2015.
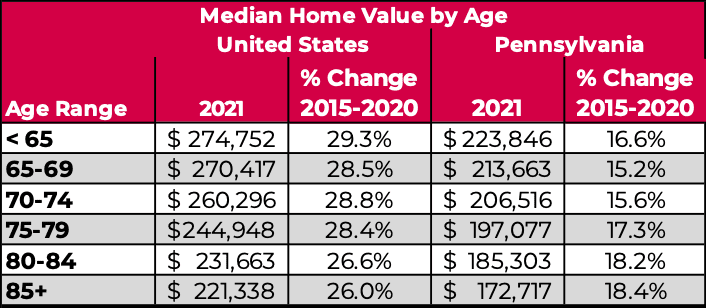
- However, these rates do vary by location, sometimes dramatically, making localized data crucial to understanding markets. For example, the growth in this group in Pennsylvania was 40 percent. While lower than some places, this is still impressive. Those in Pennsylvania with homes valued at $750K to $1M was up 57 percent for the same period.
Another trend to begin monitoring is the rate at which households of different ages own the home free and clear. It has long been assumed that older adult households have a high propensity to do so; but as aging baby boomers enter the market, one might question whether this will continue to be the case.
This is a generation that has taken on larger mortgages and/or used home equity to pay for college tuitions and renovations as well as to purchase a second home or other “luxury” items. Low interest rates may encourage the use of mortgages and applying assets to other investments.
- One source reports that older owners are carrying more mortgage debt. “The share of homeowners aged 65 and over with housing debt doubled from 1989 to 2019, from 21 to 42 percent, while the median outstanding balance rose from $18,000 to $86,000 (both in 2019 dollars) over the same period. Among owners aged 80 and over, 27 percent were carrying mortgage debt in 2019, compared with 3 percent in 1989.” [3]
- While older households are much more likely than younger households to have paid off their mortgage, the share of elderly people with a mortgage has increased gradually over time to 38 percent in 2017 for those ages 65 and older. [4]
Food for Thought
- Do increased home values offer providers latitude for higher entrance fees in the current environment, or would this diminish the perceived opportunity to prospects of recognizing a higher-than-expected contribution to their “nest egg?”
- Will continued increases in home prices ultimately result in larger outstanding mortgages later in life, thereby reducing the equity that is available for entrance fees?
- Emerging generations of older people who seek retirement living environments are known to be very different from their predecessors, and whether more people are changing how they view their housing as an asset may also be shifting. Whether the goal of owning one’s home free and clear is diminishing in favor of retaining assets in other classes such as investments, the impacts on retirement community contract structures remain to be seen. Regardless, it is worth monitoring and staying aware of these trends in our field.
If you’re interested in acquiring this kind of data for your organization’s market area, please contact us. Our state-of-the-art database includes data that are more granular and more relevant for senior housing than most other sources. Click here to get in touch.
—
Footnotes:
- Romem, Issi. “Explaining the Frenzy in the Housing Market.” The New York Times. 3 December 2020, www.nytimes.com/2020/12/03/upshot/home-prices-explaining-frenzy.html. Accessed 28 September 2021.
- Cleaver, Joanne. “Chicago housing market hurdle: As baby boomers stay put, millennials struggle to find starter homes.” The Chicago Tribune. 19 June 2019, www.chicagotribune.com/real-estate/ct-re-millennial-baby-boomer-housing-shortage-20190623-story.html. Accessed 28 September 2021.
- Molinsky, Jennifer. Ten Insights About Older Households from the 2020 State of the Nation’s Housing Report. Joint Centers for Housing Studies of Harvard University. 17 December 2020, www.jchs.harvard.edu/blog/ten-insights-about-older-households-2020-state-nations-housing-report. Accessed 28 August 2021.
- Michael Neal, Urban Institute, Urban Wire, Housing and Housing Finance, August 20, 2019, Urban Wire